In this blogpost we’ll learn how to expose SonarQube endpoint to Team Build in VSTS and run a full code analysis cycle as part of the continuous integration pipeline. We’ll then look at the code analysis results summary in VSTS and see the build version mapping between VSTS and SonarQube.
Pre-requisites
In the last blogpost we set up a SonarQube with SQL Server (Win Auth) from scratch. This blogpost builds on top of that, if you don’t have a SonarQube server configured yet, follow the instructions here before moving forward https://www.visualstudiogeeks.com/blog/DevOps/Install-SonarQube-As-WindowsService-With-SQLServer-WindowsAuth-VSTS-TeamBuild.
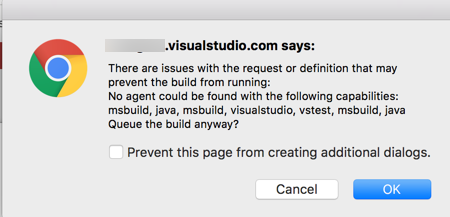
The blog post also requires that you have a VM set up with VSTS Build Agent. If you don’t already have a build agent configured on a seperate VM, then follow the instructions https://msdn.microsoft.com/en-us/library/vs/alm/build/agents/windows to set up a VSTS Agent. The Agent needs to have jave installed. SonarQube requires that the Visual Studio Agent has Java installed. If you do not have Java installed on the Agent, expect to see the following error message…
If you intent to use the hosted agent in VSTS, then you don’t need a machine with VSTS Agent set up.
Infrastructure Setup
SonarQube is setup using a single VM configuration where both the web server and the database are on one single machine. The VSTS Agent is set up on another virtual machine. For VSTS Build Agent to consume SonarQube endpoint for code analysis, the Agent needs access to SonarQube. Since SonarQube is currently configured on port 9000, the firewall rules need to be ammended on both SonarQube server and VSTS Agent to allow communication between the two boxes on TCP port 9000.
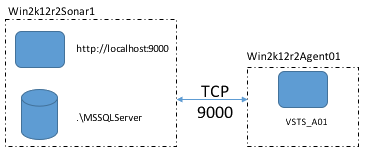
Once you have added the firewall exception to allow communication from SonarQube to VSTS Agent and visa versa on TCP port 9000, launch cmd on both the machines and telnet on port 9000 to validate the channel.
Configuring SonarQube Analysis in a build pipeline
Launch Visual Studio Team Services and navigate to the Build Hub. Click the + icon to create a new build definition. Choose the ‘Visual Studio’ build template.
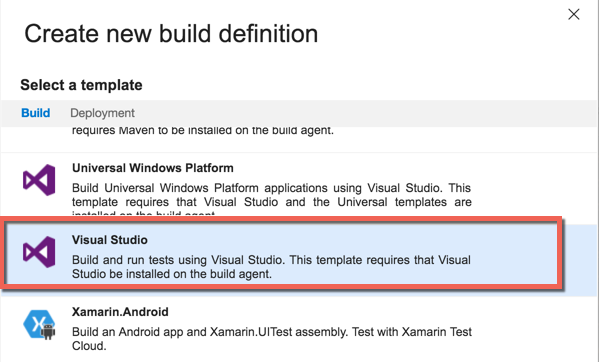
The build template adds a bunch of tasks to the newly created build definition.
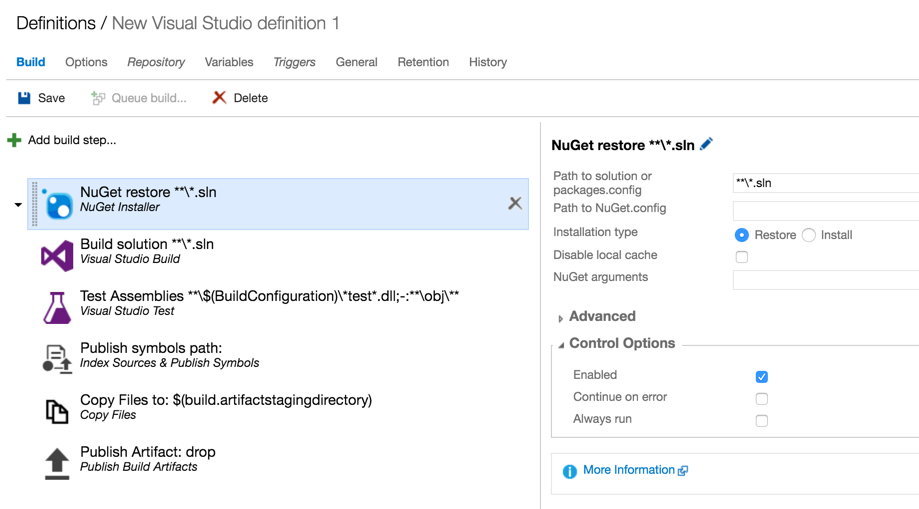
Click on the + Add build step link. This will open up the task gallery. From the Build tab Add the task ‘SonarQube for MSBuild - Begin Analysis’ and ‘SonarQube for MSBuild - End Analysis’ task. Drag the Begin Analysis task to before the Build solution step and the end analysis task to after the unit test execution task. The build pipeline should look as follows now…
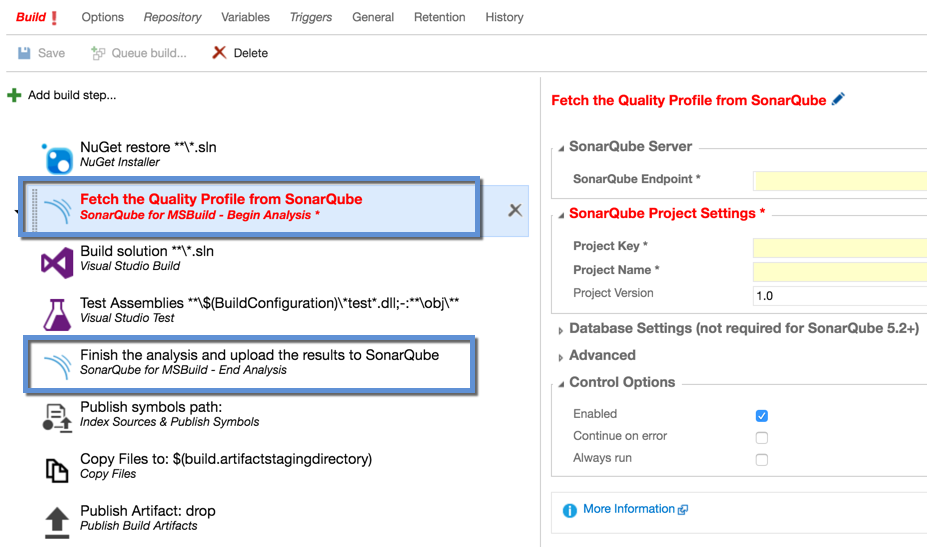
We need to make some configuration changes to the SonarQube begin analysis task.
-
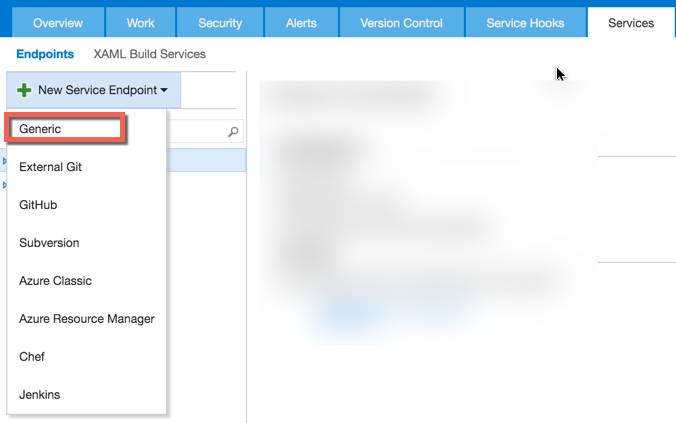
SonarQube Endpoint: The SonarQube url needs to be defined as a service in the administration console. From the SonarQube begin analysis task, from under the SonarQube server section click on ‘Manage’. This will navigate you to the services tab in the administration console.
Click on the + New Service Endpoint dropdown and select Generic. This will open up the Generic connection window.
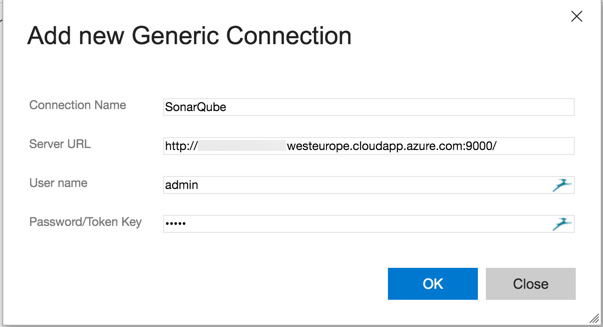
Enter the connection details of the SonarQube server and click OK.
- SonarQube ProjectKey: Name this with respect to the solution you are performing an analysis on. I am setting this to Fabrikam.CI
- SonarQube_ProjectName: Name this to reflect the project or product being analysed. I am setting this to Fabrikam.WebServices
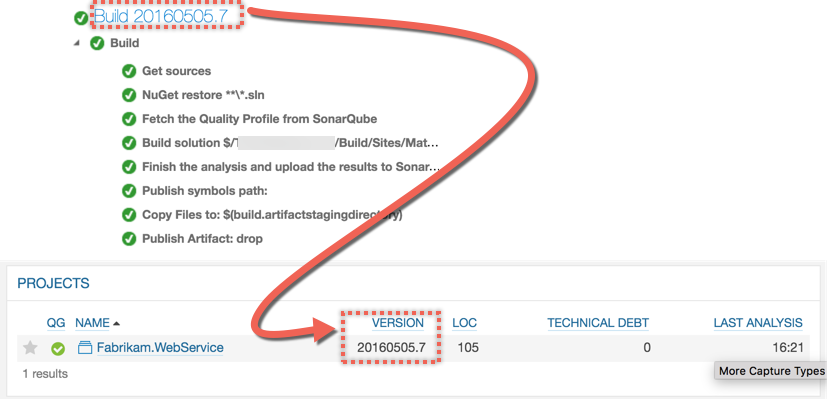
- SonarQube_ProjectVersion: By default this value is hard coded to 1.0. This isn’t great because on every build SonarQube would overwrite the previous run results. Change the value of this field to the build number so you can see the correlation between sonarQube analysis results for the specific CI build number. I am using the predefined variable
$(Build.BuildNumber). -
SonarQube_DatabaseSettings: Nothing needs to be specified here. If you are using an earlier version of SonarQube < 5.2 then this applies to you. Since we are using SQL Windows Auth no configuration needs to be specified here. _ Advanced: Skip the advanced section for now. I’ll cover Quality Gates in a future blog post.
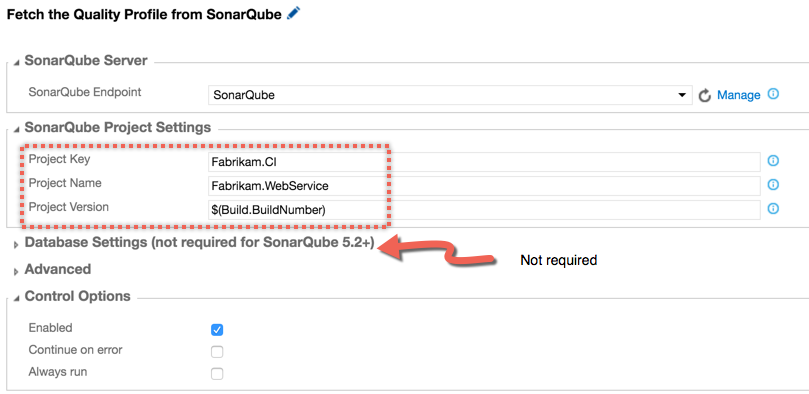
With that the configuration for SonarQube begin analysis task is complete. No configuration is required for the SonarQube end analysis task. The end analysis task is used to hand over the results file to SonarQube to process for analysing the results. Save the changes to build definition and queue a new build.
Trigger the CI Build to invoke code analysis using SonarQube
Queue a new build for this build defintion. The build will be executed on the VSTS Agent. The Agent will use the configuration details in the SonarQube begin analysis task to connect to SonarQube endpoint and retrive the quality profile (or create one if it doesn’t exist).
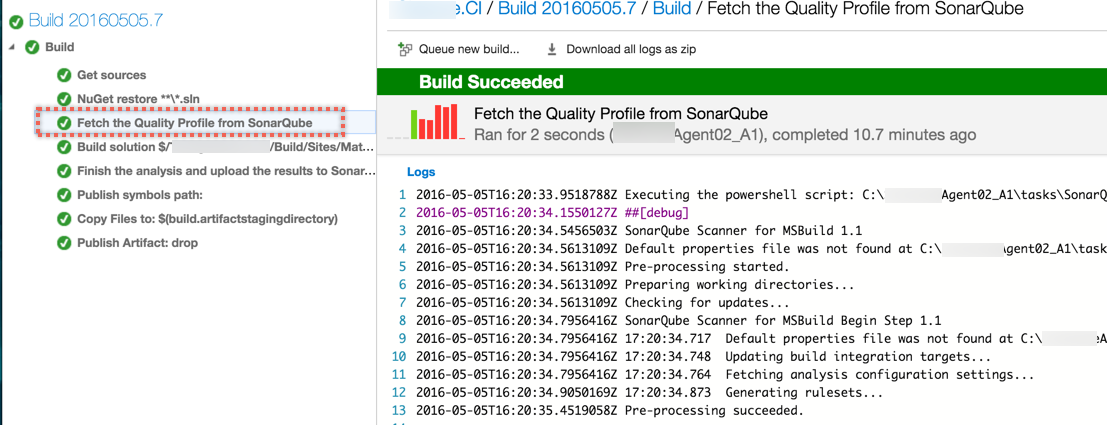
At the end of the analysis a file is handed over to SonarQube to processess.

Once the build is complete, you’ll be able to see the SonarQube analysis summary in the build results section.
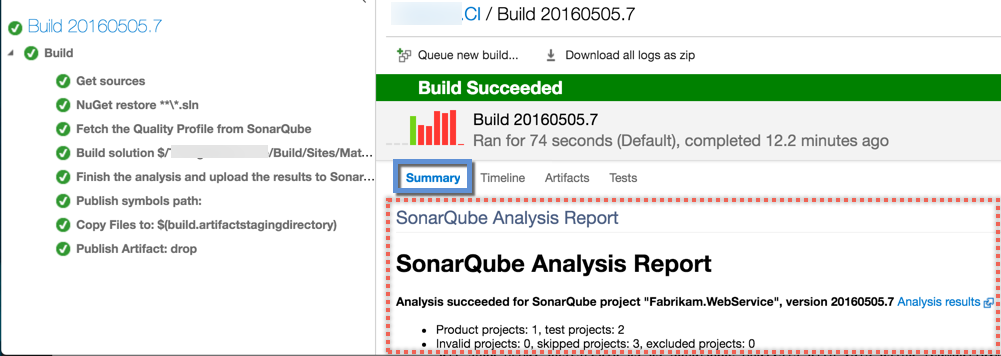
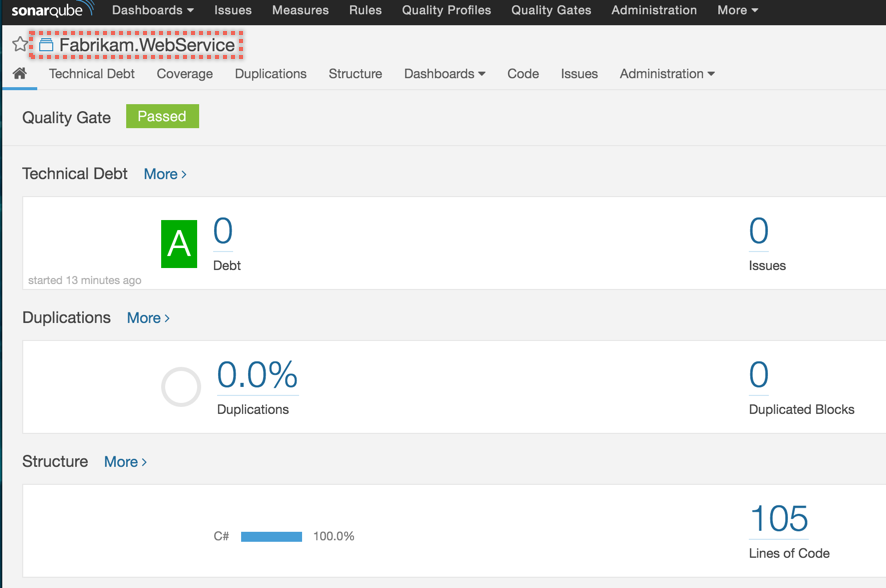
Clicking on Analyis results will navigate you into the specific Project in SonarQube to show you more details of the analysis…
Mapping SonarQube Version to VSTS Build Number
By changing the Project Version configuration to use $(Build.BuildNumber) we now have a direct linking between the build number and the analysis result in SonarQube.
Summary
In this blogpost we walked through the configuration steps to trigger SonarQube code analysis from Team Build in VSTS. In doing so we also learned how to add Services as an endpoint in VSTS. In the next blogpost we’ll learn how to fail a build in VSTS based on QualityGate configuration defined in SonarQube. I would also recommend you check out the following other blogposts on SonarQube…
- Why care about DevOps?
- What is Technical Debt & why is it a problem?
- How to install SonarQube as a Windows Service with SQL (Windows Auth) for code analysis with VSTS
How are you tackling technical debt? Is SonarQube working well for you?
Tarun


