Accelerated Networking is a feature that significantly enhances the performance you get out of a virtual machine. The feature is free but is only available in selective VM sizes. The feature is disabled by default and isn’t available to enable via the Azure Portal so doesn’t get a lot of attention either. If you are a nerd like me, you’ll freak out with the difference in the virtual machine performance with accelerated networking enabled. You gotta see it to believe it!… So, in this blog post i’ll walk through the difference in throughput and latency with and without accelerated networking….
First off, taking a step back Accelerated Networking enables single root I/O virtualization (SR-IOV) to a VM, greatly improving its networking performance. This high-performance path bypasses the host from the datapath, reducing latency, jitter, and CPU utilization, for use with the most demanding network workloads on supported VM types. You can read more about this on ms-docs
To crunch this in layman terms, Accelerated Networking is processing your data in motion right at the virtual network card, which intern allows for greater throughput and lower latency in transit.
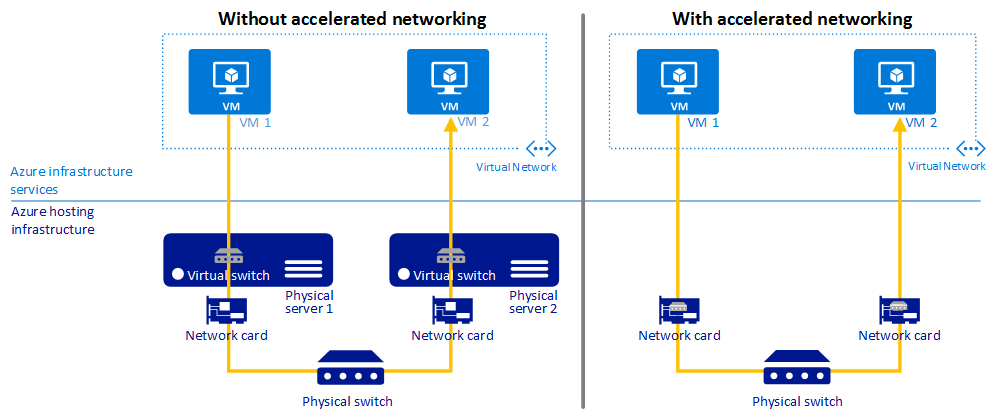 Image credit - Microsoft
Tools for testing Latency and Throughput?
PsPing “Latency”- Part of the sys-internals tools. PsPing let’s you simulate traffic over the network by specifying the frequency and packet size. You can run PsPing as a server on one VM and as a client on the other, specifying custom ports to use when communicating between the two. In the output you can generate a histogram to see the percentage of calls by latency. This in my view is really useful, especially if you are running a single threaded application where latency in one call will likely delay subsequent calls.
NTttcp.exe “Throughput” - NTttcp is one of the primary tools Microsoft engineering teams leverage to validate network function and utility. NTttcp needs to be run on the sender and the receiver. The tool allows you to specify the packet size and the duration of execution, as well as advanced features of warm up and cooldown as well as buffering. The tool let’s you run it in single threaded and multi threaded mode. In multi threaded mode you can distribute the traffic across multiple CPU cores. This is great way to test for throughput…
What is the current performance?
If you are within the same Azure region you’ll hardly ever notice any latency, however, when you go with in Azure regions whilst not using the Azure backbone you’ll notice a lot of latency. We are at the moment forced to use a less optimal data path between UK South and UK West Azure region pair as global vnet peering limits the use of Azure ILB which is a fundamental item in our SQL HA + DR design. To put this in perspective, I am going to use the PsPing and NTttcp,exe to test latency and throughput to show you how poor the traffic flow is between the region pair for us at the moment.
| VM 1 | => | VM 2 |
|---|---|---|
| DS3-v2 | DS3-v2 | |
| UK South | UK West |
Latency
In this test, i’ll make VM1 the client and VM2 the server. As you can see I’m running a session of 2000 calls where each request sends 10m of traffic over port 1433 to the server whose IP address is 10.0.0.1.
VM 1
C:\PSTools>psping.exe -l 10m -n 2000 -4 -h -f 10.0.0.1:1433
VM 2
C:\PSTools>psping.exe -f -s 10.0.0.1:1433
TCP roundtrip latency statistics (post warmup):
| Single Request Size (MB) | Total during test (MB) | Minimum Latency | Maximum Latency | Average Latency |
|---|---|---|---|---|
| 10 | 20,971.52 | 111.23 ms | 1579.38 ms | 521.03 ms |
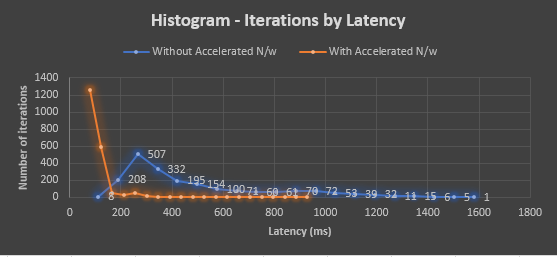
Histogram of distribution in latency of data transfer during the test,… As you can in the chart below over 16% of calls had > 1 second of latency…
A histogram helps drive the point home, if you are running a single threaded operation. Even though 16% of the calls have 1 second of latency, the overall impact to a long running process would be significant.
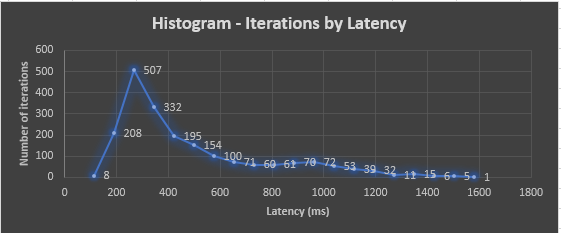
Next let’s see the throughput through the pipe when not using accelerated networking…
Throughput
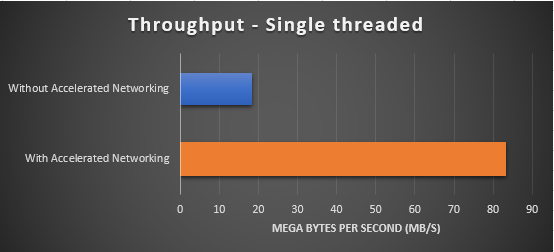
In this test, I’ll make VM1 the sender and VM2 the receiver. The sender has started a single threaded operation that sends packets of 10 mb to the receiver for a period of 300 seconds over port 50002.
Single Threaded
VM 1
C:\NTttcp-v5.33\amd64fre>NTttcp.exe -s -p 50002 -m 1,*,10.0.0.1 -l 10m -a 2 -t 300
VM 2
C:\NTttcp-v5.33\amd64fre>NTttcp.exe -r -p 50002 -m 1,*,10.0.0.1 -rb 10m -a 16 -t 300
| Bytes(MEG) | realtime(s) | Avg Frame Size | Throughput (MB/s) |
|---|---|---|---|
| 5527.12 | 300.00 | 1375.46 | 18.42 |
Multi Threaded
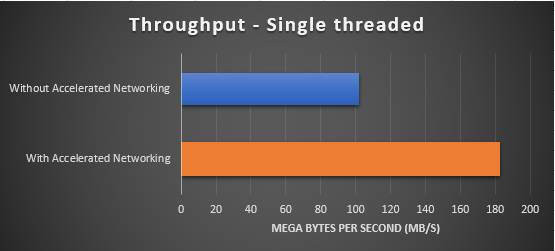
When running the same commands in multi threaded mode where the operation is distributed across 8 threads, leveraging the multiple cores of the machines…
VM 1
C:\NTttcp-v5.33\amd64fre>NTttcp.exe -s -p 50002 -m 8,*,10.0.0.1 -l 10m -a 2 -t 300
VM 2
C:\NTttcp-v5.33\amd64fre>NTttcp.exe -r -p 50002 -m 8,*,10.0.0.1 -rb 10m -a 16 -t 300
| Bytes(MEG) | realtime(s) | Avg Frame Size | Throughput(MB/s) |
|---|---|---|---|
| 10178.82 | 100.00 | 1375.50 | 101.78 |
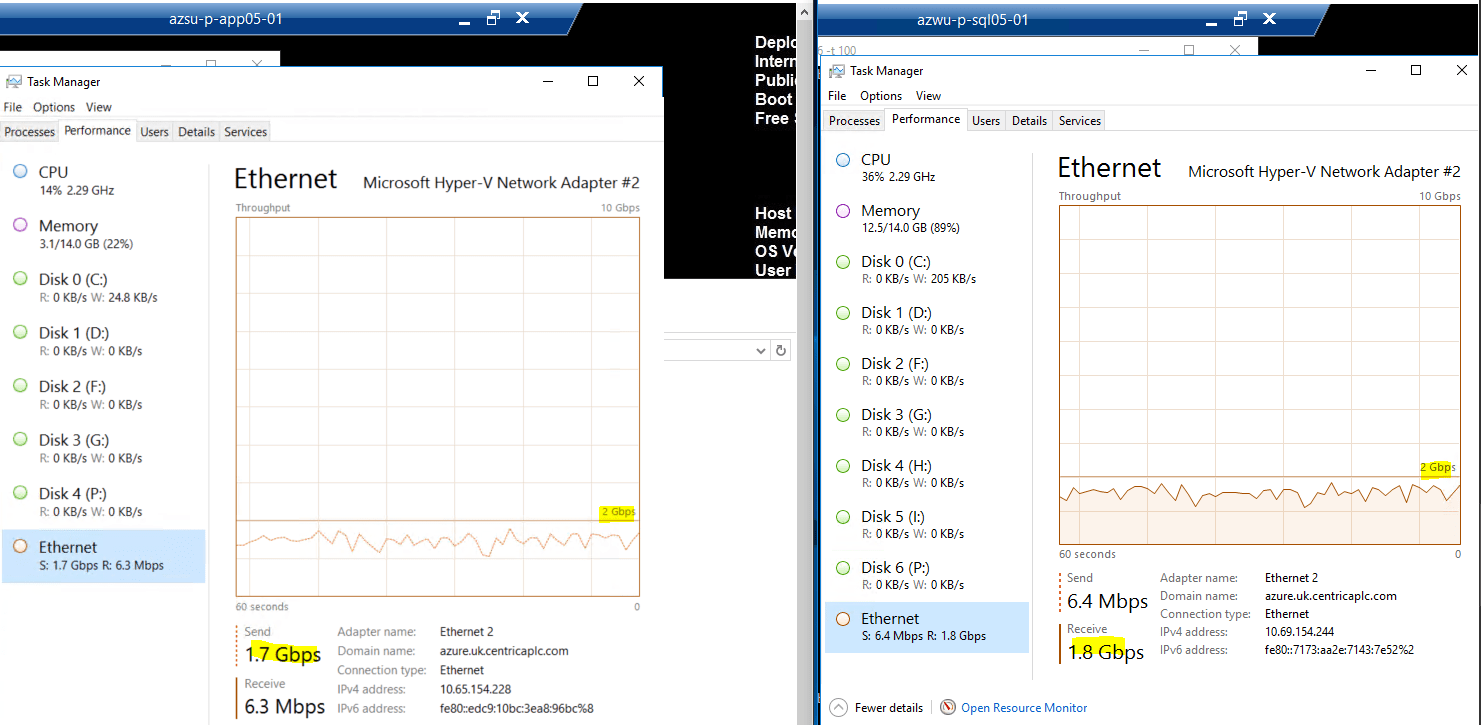
Here is a glimpse of the traffic flowing between the virtual machines …
Enabling Accelerated Networking on existing VM
As you can see the VM’s where I am running the test currently have accelerated networking disabled.

Luckily Azure supports enabling Accelerated networking on pre-provisioned virtual machines. The steps are quite well documented in Microsoft docs. You simply have to switch off the VM and update the network card property to EnableAcceleratedNetworking to true.
$nic = Get-AzureRmNetworkInterface -ResourceGroupName "azsu-rg-prod-xxx-001" `
-Name "azsu-p-sql-001-nic"
$nic.EnableAcceleratedNetworking = $true
# Set the accelerated networking property to true
$nic | Set-AzureRmNetworkInterface
Performance with Accelerated Networking
I’ll run the same test to gauge latency and throughput with the same parameters on the same size VMs, the only difference being that the machines now have accelerated networking enabled…

Latency
TCP roundtrip latency statistics (post warmup):
| Single Request Size (MB) | Total during test (MB) | Minimum Latency | Maximum Latency | Average Latency |
|---|---|---|---|---|
| 10 | 20,971.52 | 77.16 ms | 929.43 ms | 124.56 ms |
Histogram of distribution in latency of data transfer during the test,… As you can in the chart below over 99% of calls had < 300 ms of latency…
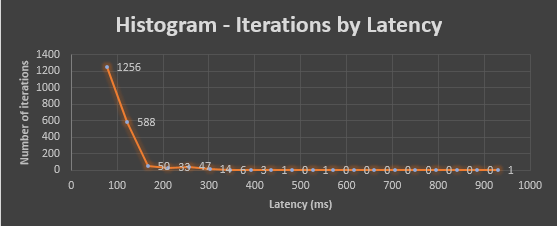
Let’s now look at these numbers with respect to the previous run…
Throughput
Single Threaded
| Bytes (MEG) | realtime(s) | Avg Frame Size | Throughput (MB/s) |
|---|---|---|---|
| 24943.97 | 300.00 | 1375.42 | 83.14 |
Let’s now look at the throughput with respect to the previous run…
Multi Threaded
| Bytes(MEG) | realtime(s) | Avg Frame Size | Throughput (MB/s) |
|---|---|---|---|
| 18240.00 | 100.00 | 1376.42 | 182.39 |
Let’s now look at the throughput with respect to the previous run…
Summary
By enabling Accelerated networking I was able to get up to 80% reduction in latency and over 40% improvement in throughput. In this blog post I’ve walked you through the improvement in the performance of the virtual machine with the reduction in latency and improvement of throughput when constrained by the choice of routing within our private vnet. The results are even more awesome when you have the optimised solution running within the same region. It confuses me why Microsoft doesn’t have accelerated networking enabled as default on all machines, but if you haven’t already set this up on your own virtual machines for even better performance.
Hope you found it useful…
Tarun


